

Latest
01
Oct
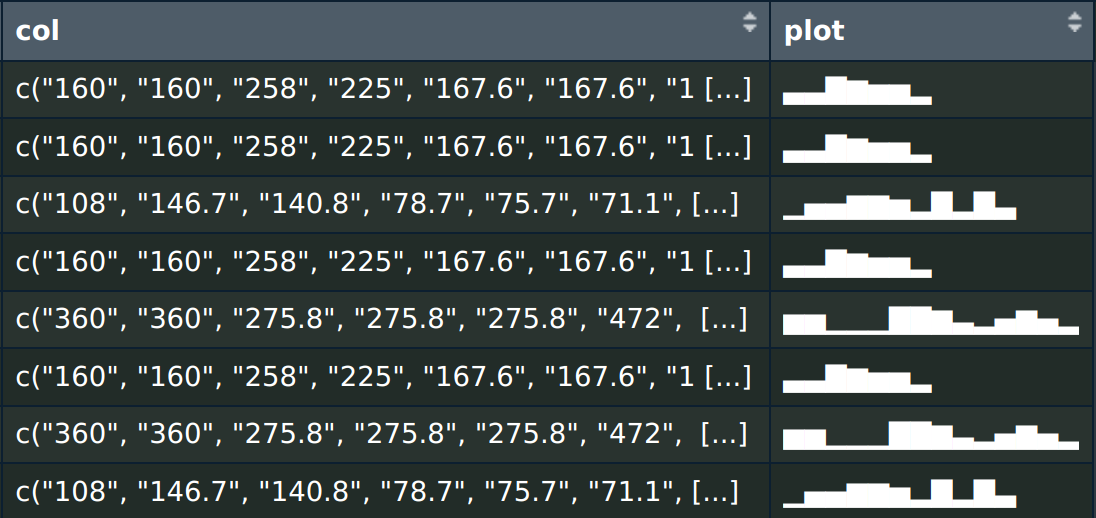
Charting Data Differently: Text-Based Visualizations in R
In our love affair with ggplot2, we might sometimes overlook a simpler approach: creating ASCII plots directly in a data.table.
3 min read
17
Nov
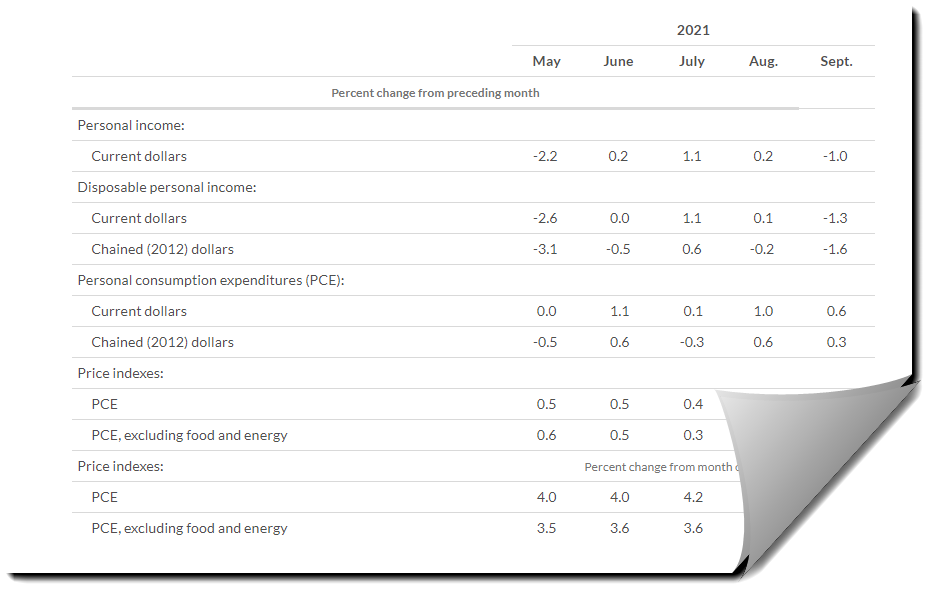
Theory #4: The US Balance of Trade Explained
During the recent US election, the concept of the balance of trade was bounced around a lot, but not always used in the correct manner. This is due to a combination of politics and ignorance, and can be cured by understanding exactly how the balance of trade works.
9 min read
21
Oct
Investing: ETF Asset Allocation Strategies Explained
ETFs have sky-rocketed in popularity in the last few decades, making them the go-to asset class for investing. They are easy to understand, are able to follow a broad selection of market securities, and come with very low management fees.
11 min read
05
Oct

Overview: Leading, lagging, and coincident economic indicators
Markets are constantly looking for signs that indicate that the current economic climate is about to change. Those signs are usually provided by economic indicators which are regularly reported and closely followed by traders and investors around the world.
8 min read
01
Aug

Theory #3: Understanding the Efficient Market Hypothesis
In financial economics, there is a heated debate among academics over whether it’s possible to generate excess returns above the average market return. Because, if a group of traders or investors is able to outperform the general market, that market couldn’t be described as efficient.
11 min read
14
May

The Chinese renminbi: On its way to free-float
Almost seven years have passed since June 2010, when China’s government indicated it would continue with financial reforms and make the renminbi exchange rate more flexible, satisfying major world economies and their leaders who believed the renminbi is excessively undervalued.
4 min read
01
Jan
Portfolio #1: Calculating the Federal Reserve rate change probability using Fed Funds futures
Calculating the Federal Reserve rate change probability using Fed Funds futures
01
Jan

Portfolio #4: Monte Carlo simulations and GBM
01
Jan

Portfolio #3: Yield curve analysis and sector rotation in the equities market
01
Jan
